Quickstart
Make sure you have correctly installed the project first.
The project comes with some built-in demo files for you to test.
Backtest a demo file after installation:
python -m contango.research.research_strategies.bollinger_band_mean_reversion.runner
Under the research/research_strategies/bollinger_band_mean_reversion directory (in the folder that you ran the demo command in), you should see a graphs/ folder, which contains all of the generated graphs as HTML files. Open the folder, and then open the HTML files.
To do this, use the VSCode Live Server Extension to open the graphs in your defaulted browser. If you already have a way to easily view HTML files: Jump to Next Steps
Setting up a live server
After downloading the extension and right clicking any file in the graphs/ directory, you should see this popup:
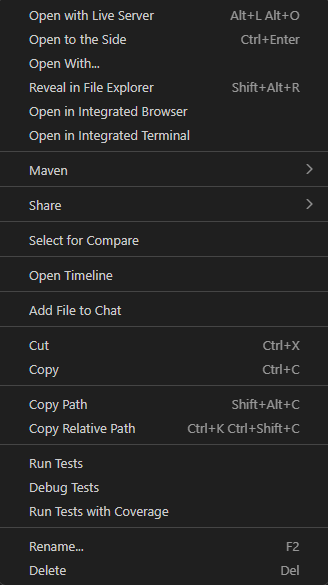
Click Open with Live Server:

This will take you to any graph page, depending on which HTML file you chose. Take note of the URL:
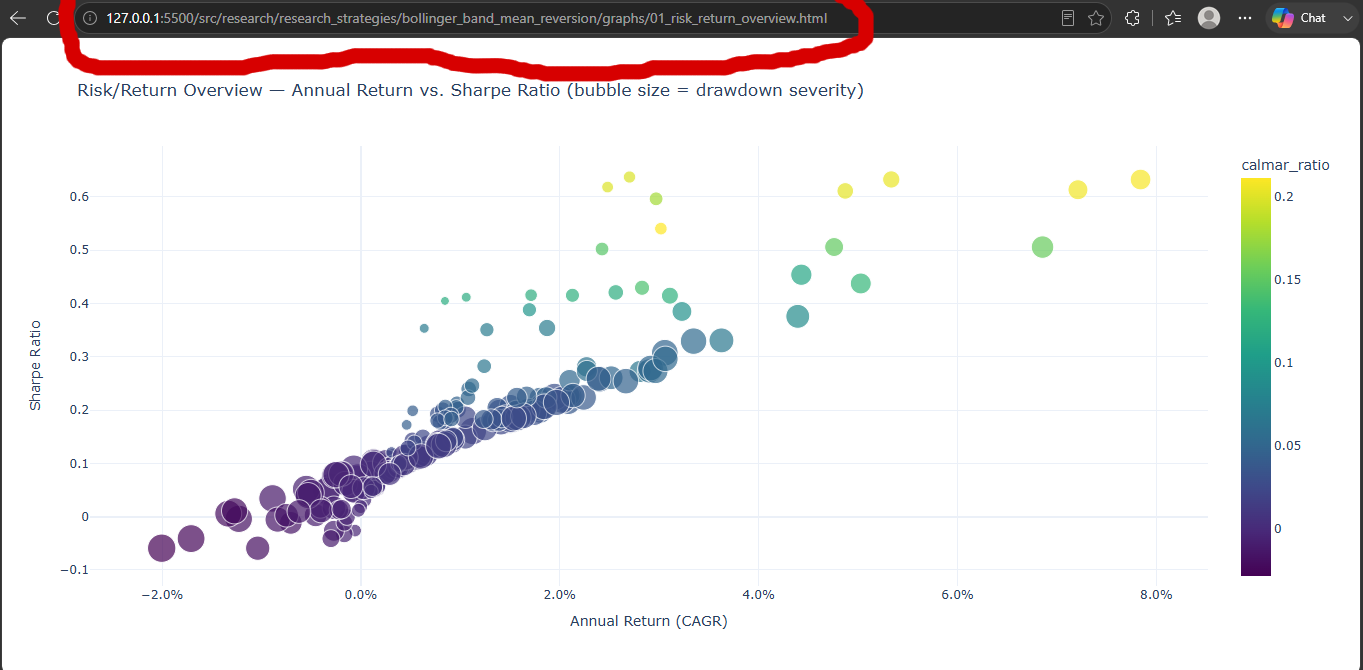
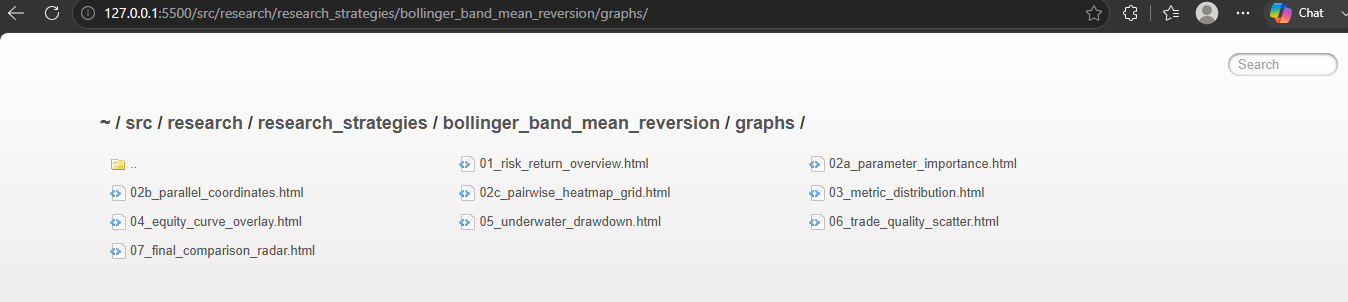
In my case, the URL was http://127.0.0.1:5500/src/research/research_strategies/bollinger_band_mean_reversion/graphs/01_risk_return_overview.html. You want to simply get rid of the graph_name.html section. Your URL name should look similar (if not identical) to this: http://127.0.0.1:5500/src/research/research_strategies/bollinger_band_mean_reversion/graphs. This will take you to the graph directory - you can explore the other graphs if you would like.
Next steps
Once you're here, head to Graphing to interpret the generated results.